
Illustrative use case. All dollar amounts, supplier terms and scenarios below are invented teaching assumptions in USD. They are not supplier quotes, current tariff rates, forecasts or AppFX client results. Contribution is after the listed variable costs, before fixed overhead and tax.
Two suppliers offer products for the same proposed customer offer. One quotes $8 per unit; the other quotes $11. Choosing the first seems straightforward until delivery, fulfilment, returns and the cash tied up in the minimum order enter the comparison. A supplier quote is one input to a business case. The decision concerns an entire route from product to customer.
AppFX uses AI Business teammates to connect product research, offer development, supplier questions and logistics around competing scenarios. The goal is a business plan that can change as evidence arrives. A lower quote may win. It needs to win on the same customer promise and the same accounting basis as the alternatives.
Define the offer before comparing the costs
Start with a clear unit of comparison: one delivered order for a hypothetical physical-product offer sold through digital channels. Both options below have the same $50 net selling price after discounts, excluding sales tax. This example uses no repeat-purchase benefit and assumes the listed acquisition cost applies to each order. Neither option gets credit for revenue that has not been demonstrated.
The two offers are intended for the same audience, but their supply routes differ. Option A uses a lower factory price and a longer inbound route. Option B has a higher unit price, lower inbound costs and a simpler fulfilment arrangement. Before comparing them commercially, sample evaluation would still need to establish acceptable quality and whether both can deliver the promised experience.
The U.S. International Trade Administration’s guidance on total export price includes transport, duties and other charges in the wider landed-cost picture. The practical lesson here is to identify the full set of costs. Actual amounts depend on the product, route and current terms; this example supplies assumptions rather than applying a tariff rate.
Put every variable cost on the same page
Keep the supplier product price separate from inbound costs so nobody counts freight twice or omits it altogether. The assumed landed costs below include the product plus inbound freight, duty and related inbound charges. Outbound fulfilment and customer delivery appear in their own row.
Scroll across to compare all columns.
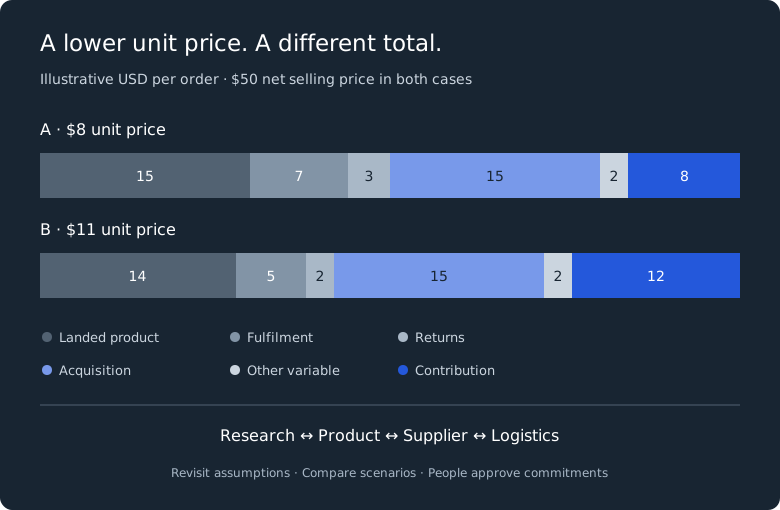
| Per delivered order, USD | A: lower unit price | B: higher unit price |
|---|---|---|
| Net selling price | $50 | $50 |
| Supplier product price | $8 | $11 |
| Inbound freight, duty and charges | $7 | $3 |
| Total landed product cost | $15 | $14 |
| Fulfilment and customer delivery | $7 | $5 |
| Returns allowance | $3 | $2 |
| Customer acquisition | $15 | $15 |
| Payment and other variable costs | $2 | $2 |
| Contribution per order | $8 | $12 |
| Contribution / net selling price | 16% | 24% |
For A, the calculation is $50 − $15 − $7 − $3 − $15 − $2 = $8. For B it is $50 − $14 − $5 − $2 − $15 − $2 = $12. The total landed row is a subtotal, not an additional expense. The $3 and $2 returns allowances are assumed average net costs per order, including relevant refund losses, handling and recoveries. They are not return percentages.
Stress the assumptions that could reverse the decision
The base case gives B a $4 advantage. That is useful only if its inputs survive scrutiny. Perhaps acquisition costs rise or returns handling is more expensive than expected. Change those assumptions explicitly instead of hiding uncertainty in a single margin number.
In a shared downside case, raise acquisition cost from $15 to $21 and the returns allowance by $2 for each option. A’s contribution falls to $0; B’s falls to $4, or 8% of the $50 selling price. This is not a probability estimate. It shows what the economics look like under a defined adverse condition.
Now challenge the apparent winner. If only B’s acquisition cost is $4 above its base assumption, its contribution becomes $8 and the base advantage disappears. If B needs both higher acquisition spending and more returns support, it can become the weaker case. Product positioning, fit and delivery experience therefore belong in the economic discussion. They influence assumptions that a factory price cannot answer.
The useful questions are concrete: what test could narrow the acquisition range, which sample findings could increase returns costs, and which logistics quote could change delivery costs? AI Business teammates can keep these questions connected and recalculate scenarios. People judge the evidence and set acceptable limits.
Compare inventory exposure separately
Minimum order quantities affect the initial commitment even when a per-order scenario looks attractive. Assume A requires 1,000 units and B requires 300. At the product prices above, the initial supplier amounts are $8,000 and $3,300. Applying the illustrative inbound costs gives landed inventory exposure of $15,000 for A and $4,200 for B. These exclude other launch spending and working-capital needs.
This is cash committed to inventory, not another per-order expense to subtract from contribution. The table already includes the unit costs. Payment timing, lead time, replenishment reliability and the cost of unsold stock still need their own review. A nominally profitable order does not guarantee enough cash to fund a large first order or a second order before the first has sold.
Make the feedback loop useful
The comparison should return questions to every part of the business case. Research may reveal that a second product adds little perceived value. Product development may simplify packaging. A supplier may offer different terms. A delivery route may change what the business can promise. Each finding updates the scenario and may change the preferred offer.
The deliverable is a decision summary: a defined customer offer, comparable cost assumptions, source dates, base and downside calculations, inventory exposure and unresolved questions. It identifies what would change the recommendation and what evidence to obtain next. People choose the scenario and approve commitments; no spreadsheet or AI teammate makes that investment decision for them.
The next move may be a sample order, a narrower offer test, a different supply route or a decision to stop. A useful business case makes each option visible. The strongest case is the one that connects a credible customer promise to costs, evidence and a commitment the business is prepared to make.